

At Tegrita, we welcome collaborators and guest writers to contribute content to our blog. This week, Kim Tworek, Marketing Manager at Gogo, shares how to set up a simple Account-Based Marketing dashboard in Eloqua’s new Insight powered by OBIEE.
As a company, Gogo’s focus is Account-Based Marketing (ABM), so our reports and dashboards need to reflect that. Building a dashboard in Eloqua’s new Insight is something new to learn and determine how to leverage the capabilities of the reporting engine. Personally, I am a fan of learning through trial-and-error, so after a few weeks of pushing buttons to see what happens, I found a fairly simple solution to get to where we want to be with reporting at Gogo.
First things first: You need to make sure you have the Eloqua Analyzer License and it is applied to your user. It doesn’t cost anything extra because Oracle recently made changes and now all Oracle Eloqua customers have access to Eloqua Analyzer, just submit a support request to have it enabled (contact Oracle to determine the number of licenses you have been allocated).
Start with the Reports you need
The first step to building a dashboard is to create the reports that will go into it. To begin, I used reports found in ‘System Reports’. These reports are a great starting point and you can easily edit them to suit your needs as long as you stay within the same subject area. By clicking edit, you can add any attributes and metrics you want to see. This is powerful because you can use any data you’re collecting. You can also create filters to pull in specific campaigns, accounts and more.
My report criteria may look something like this:
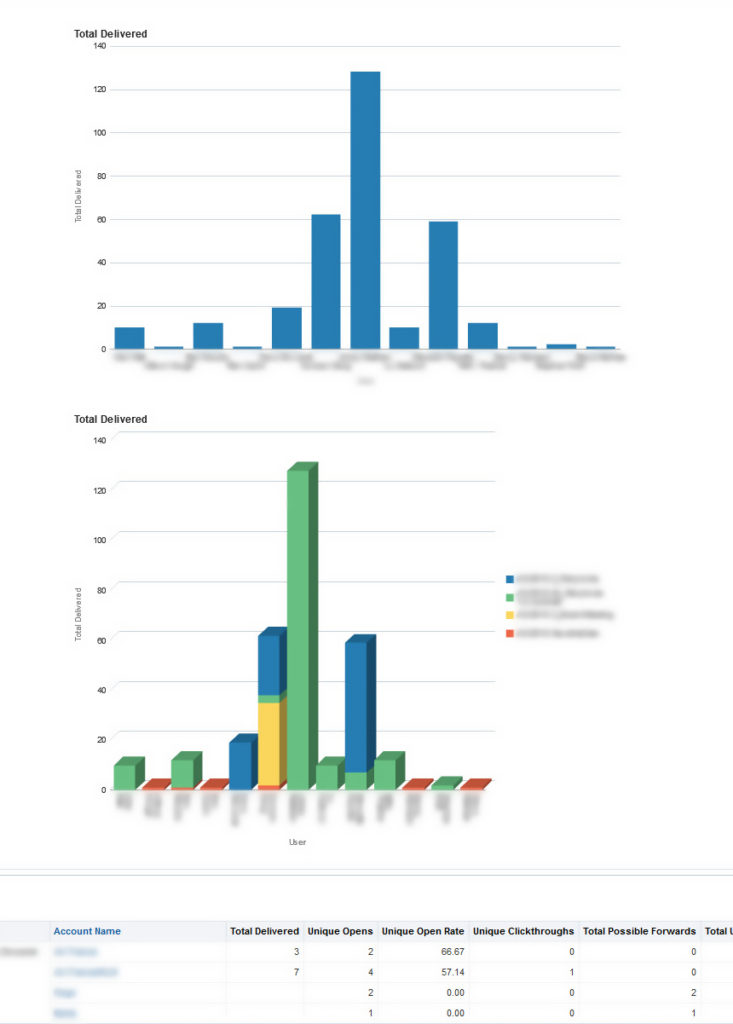
 Next, click on the ‘Results’ tab. Here you will see what your criteria pulled in and you can move columns around to have them in an order that makes sense to you. Within the ‘Results’ tab, you can also add charts and graphs.
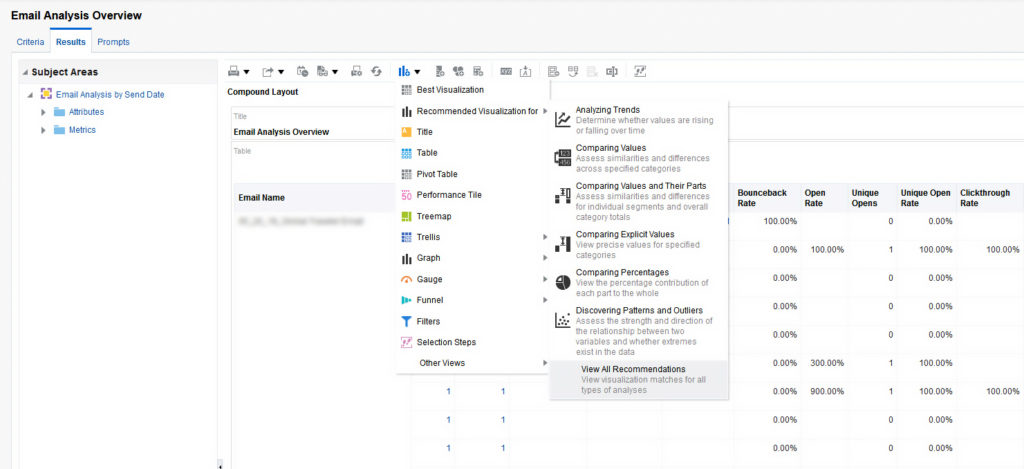
For example, our marketing team was interested in the results of our newsletter campaign by device opens. After creating a custom report and adding criteria for device category, brand name, email name, and unique and total opens, I was able to start creating charts.
I played around with chart options to determine which of the visuals best suited our needs. The charts appear below your table view. Insight also provides an option to analyze your data and will give you a recommended visual (I used many of the recommendations when building my own reports and dashboards as they are a great starting point).
For this particular report, I chose the pie view:
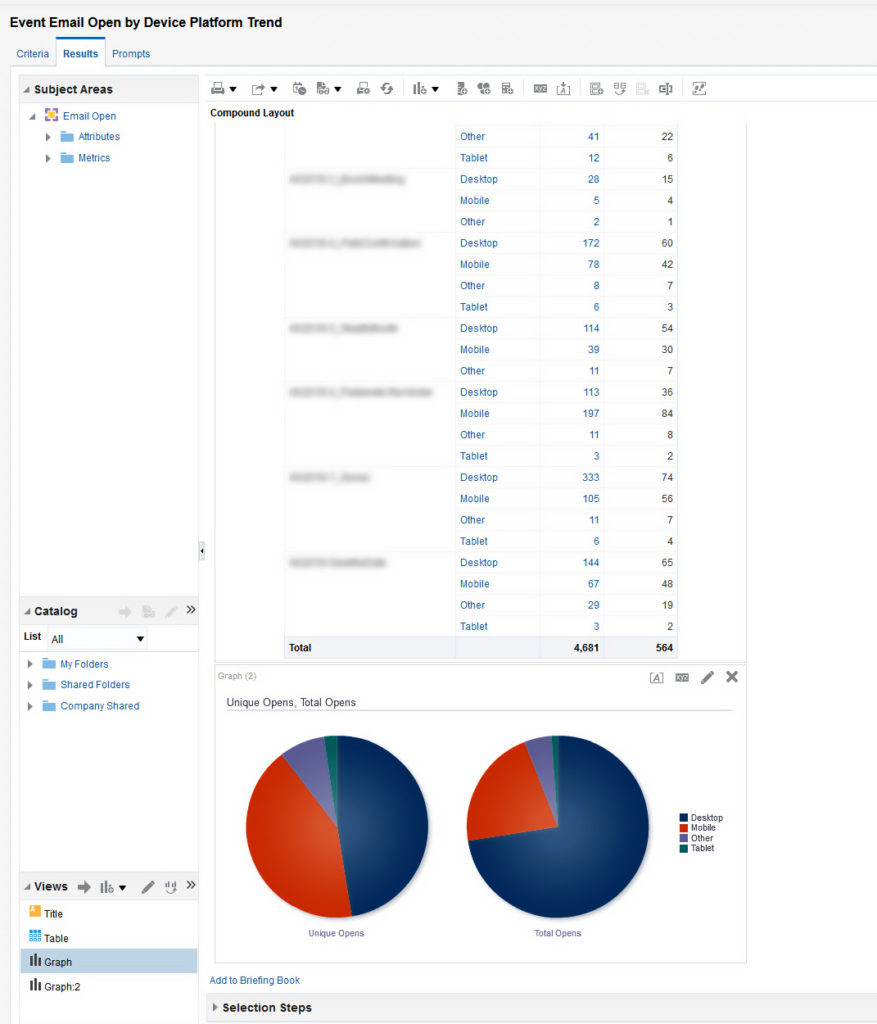 Below the chart are layout options. Chart prompts will allow a drop down at the top to switch between different views. Let’s say you want to allow the viewer to change between Email Name, and view the results that way. You can add Email Name as a chart prompt, and a drop-down will appear at the top. Dashboard viewers can then use that drop-down to choose a specific email to view. For the purposes of this chart, we just wanted to see what percentage of our newsletters were being opened on each mobile device.
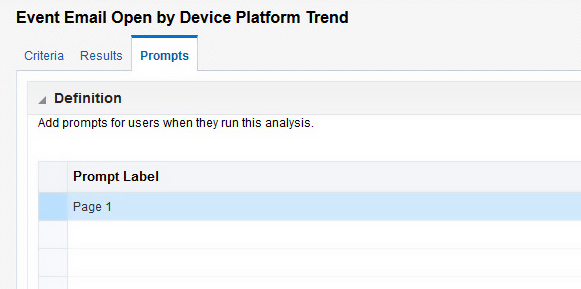
After your report is complete, select the ‘Prompts’ tab. If you plan on getting these reports into a dashboard without any odd formatting issues, for now, it appears that removing all the prompts is the only way to go. So, your ‘Prompts’ tab should look something like this:
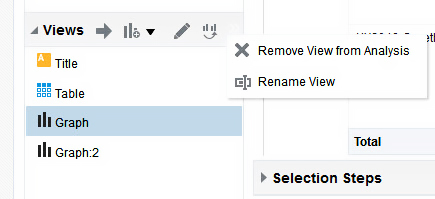
 Now you’re ready to start building out your dashboards! It is important to name everything wherever you’re presented with the option to do so because when you create your dashboards, having a name for each piece of information will be very helpful. As I continued to test charts and graphs, they kept being added to my views box in ‘Results’. The more naming you can add, the easier dashboard building is. Change names to your charts, tables and graphs here (within the Results tab):
 Building your Dashboard
To build a dashboard, select ‘New’ up in the top nav and then select dashboard. You should have a blank slate:
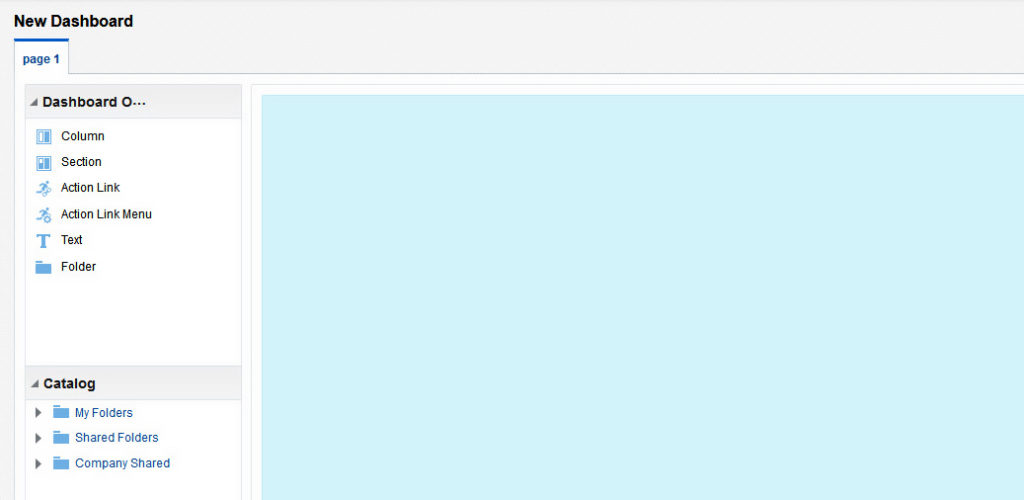 From here you can start adding columns and sections from the top left nav, so let’s start with a column and one section. Once you have dropped in these columns, you can add your report. From ‘Catalog’, simply go to the folder where your custom reports reside, and drag and drop the one you want into the dashboard.
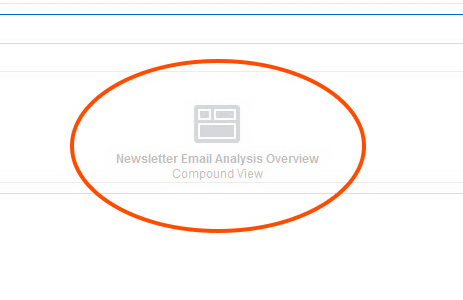 You will see that the system automatically selected compound view. You can click preview up at the top right and see what exactly this looks like. You will notice it lays out exactly how you have it in the ‘Results’ tab of the report. Please note, when you view the Reports tab, if you have a chart with prompts, the prompts don’t work in the preview…they will work when you run the dashboard live.
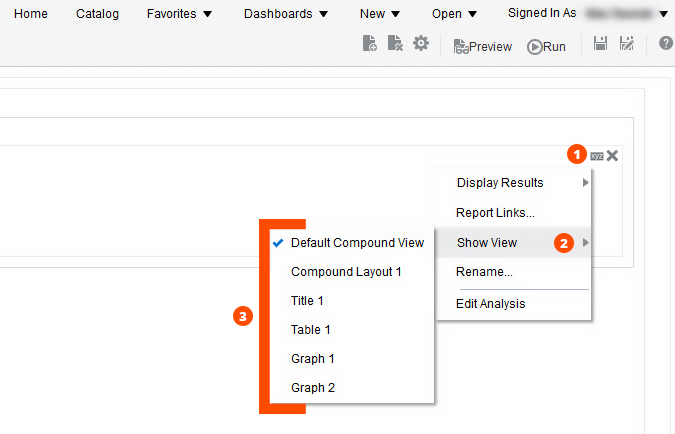
If you decide you don’t want to show the compound view, and only want to show the table, click on the gray box that says ‘xyz’ within the report. In these dashboards, each column, section and report has separate properties which you can edit. In ‘xyz,’ you will have the option to select which of the reports you want to include. As you can see in this example, naming is important because everything you created will appear.
 You can also add pages to make it easier for users. Here, I have added three pages, however, these pages allow my users to easily get to the data they want.
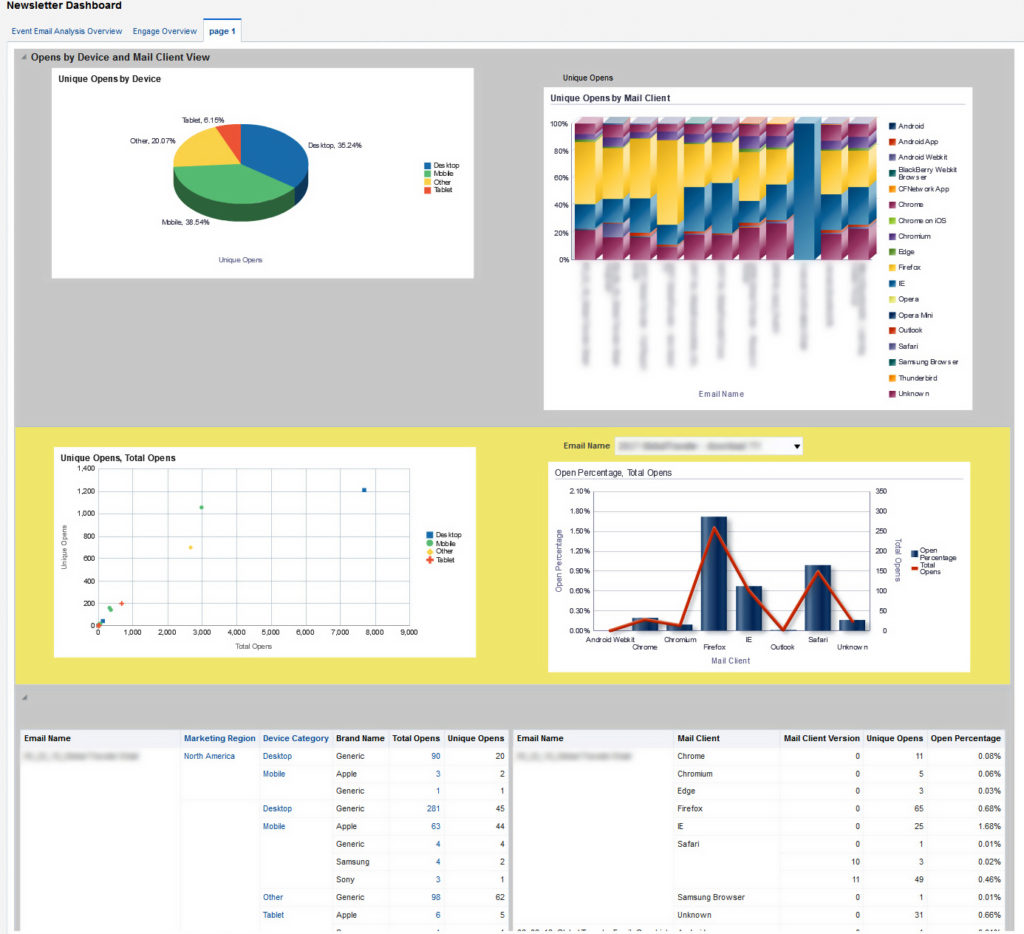 By using multiple pages, columns and sections, and naming my tables and charts, I was able to create interactive dashboards to share with the marketing team. While there are still kinks that need ironing out in my dashboards, we are one step closer to a true ABM strategy as we can now see results based on Account and make smarter B2B marketing decisions.
Eloqua Insight (OBIEE) has proven to be more challenging to learn compared to the old Eloqua Insight Classic, however, it does provide a lot of information and virtually anything you can dream up is at your fingertips.
Learn more about ABM with these pro-tips for reaching anonymous and known buyers.


![The Channel CRO [It’s What You Do with Brandi Starr]](https://content.cdntwrk.com/mediaproxy?url=https%3A%2F%2Fcontent.cdntwrk.com%2Ffiles%2FaHViPTgyNTIzJmNtZD1pdGVtZWRpdG9yaW1hZ2UmZmlsZW5hbWU9aXRlbWVkaXRvcmltYWdlXzY0ZTUwZDRkNzUxNGYucG5nJnZlcnNpb249MDAwMCZzaWc9YjM2ZWY5ZDVhNjUwY2RhMTNkMzM1MTY4OTFjNTY0YTI%25253D&size=1&version=1692732949&sig=896a21890cb589e6d4caf2b1fd16150f&default=hubs%2Ftilebg-blogs.jpg)

![Rebel Intrapreneur [Episode 45: Brandi Starr A New Generation of Executive]](https://content.cdntwrk.com/mediaproxy?url=https%3A%2F%2Fcontent.cdntwrk.com%2Ffiles%2FaHViPTgyNTIzJmNtZD1pdGVtZWRpdG9yaW1hZ2UmZmlsZW5hbWU9aXRlbWVkaXRvcmltYWdlXzY0YjA0OTUzMGIxZjUucG5nJnZlcnNpb249MDAwMCZzaWc9NjA1NDQ3YzNjZWYyOTkxYTY2MzgxODllMmU1ZmE0MTE%25253D&size=1&version=1695053332&sig=cd24ad7dc68bc455ce6258472b49f26b&default=hubs%2Ftilebg-blogs.jpg)

![Spamming Zero Podcast [E 51: How To Conquer Communications In Marketing Operations]](https://content.cdntwrk.com/mediaproxy?url=https%3A%2F%2Fcontent.cdntwrk.com%2Ffiles%2FaHViPTgyNTIzJmNtZD1pdGVtZWRpdG9yaW1hZ2UmZmlsZW5hbWU9aXRlbWVkaXRvcmltYWdlXzY0NzdhOTk1YzdkMzcucG5nJnZlcnNpb249MDAwMCZzaWc9NTE1MmZkNGM1YmU1MTg1NDdiNjczOTQ3NDE3MjhkNzE%25253D&size=1&version=1688062578&sig=de26b17088ca14016cb182437cfb42d2&default=hubs%2Ftilebg-blogs.jpg)
![The Adaptive Executive Podcast [E 32: Using Language of Service with Tegrita’s Rolly Keenan]](https://content.cdntwrk.com/mediaproxy?url=https%3A%2F%2Fcontent.cdntwrk.com%2Ffiles%2FaHViPTgyNTIzJmNtZD1pdGVtZWRpdG9yaW1hZ2UmZmlsZW5hbWU9aXRlbWVkaXRvcmltYWdlXzY0NWUzYzczMWI0NDAucG5nJnZlcnNpb249MDAwMCZzaWc9MDA1ZTgzYTc4YWRkMmQzODAyOGYzM2ZkMmU1N2I3ZGE%25253D&size=1&version=1683901167&sig=d468c97df1ecadd8226dc4e37393f7fd&default=hubs%2Ftilebg-blogs.jpg)


